15 Sept 2022 · 6 min read
What is a ROC curve?
The Receiver Operating Characteristic curve is the standard way to evaluate a binary classifier, and it exists because the obvious metric - accuracy - is misleading exactly when the problem matters most.
The threshold
A probabilistic classifier doesn't output a class, it outputs P(Y=1 | x). Turning that into a decision requires a threshold. If P(Y=1 | x) = 1/2 you're indifferent; if it's 5/7 you'd predict class 1. For the standard symmetric case the optimal threshold is 1/2 - which is exactly what logistic regression does by default. But 1/2 is a choice, not a law.

Why accuracy lies
Suppose you're classifying emails as attack or harmless, and 0.1% of the dataset is an actual attack. A classifier that says 'harmless' every single time scores 99.9% accuracy and is completely worthless. You need a metric that doesn't let the majority class hide the failure.
TPR and FPR
- True Positive Rate = true positives / all actual positives. Of the real attacks, how many did you catch?
- False Positive Rate = false positives / all actual negatives. Of the harmless emails, how many did you wrongly flag?


The all-harmless classifier scores TPR 0 and FPR 0. The all-attack classifier scores TPR 1 and FPR 1. Neither is useful, and both are now visibly useless - which is the point.
The curve
One threshold gives you one pair of numbers, and therefore one point in the FPR/TPR plane.
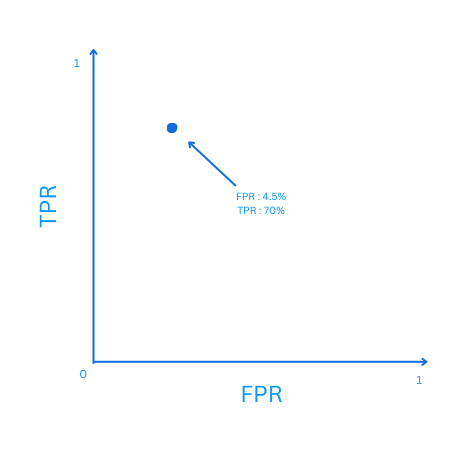
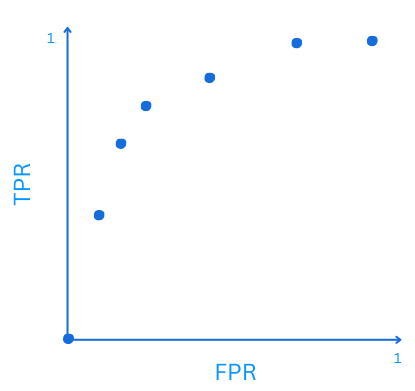
Sweep the threshold from 1 down to 0 and you get a point for every operating decision. At threshold 1 you predict nothing positive and sit at the origin; at threshold 0 you predict everything positive and sit at the top right.
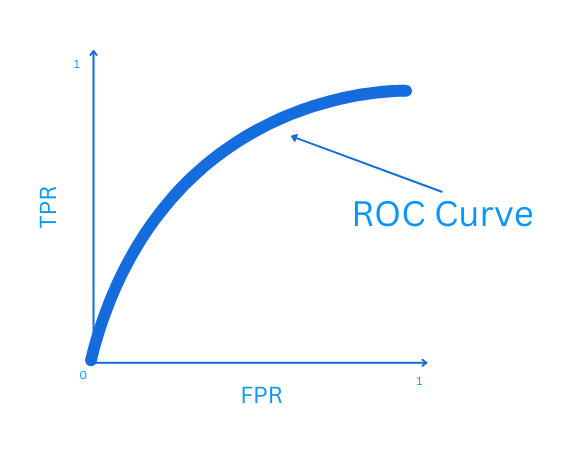
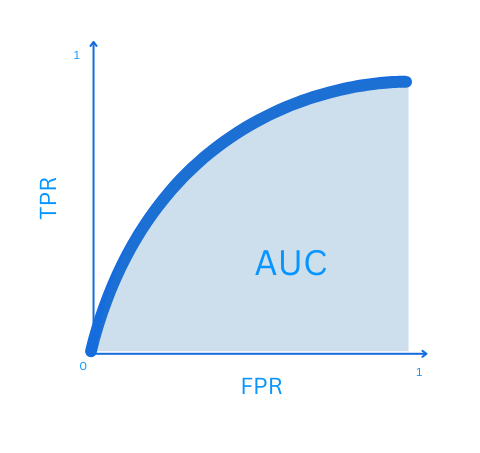
A random classifier traces the diagonal. A perfect one hugs the top-left corner. The area under the curve summarises the whole thing in a number, and has a neat interpretation: it's the probability that a randomly chosen positive is ranked above a randomly chosen negative.
Which point on the curve you actually pick is not a statistical question. It's a business one about what a false positive costs relative to a false negative.